Dashboard
The web UI for watching what Agent Smith is doing — and, just as important, what it did last Tuesday and what that cost. It reads from the server's database and event stream; the only things it writes back are a run cancel and your configuration edits.
Running it
The dashboard is a Next.js app shipped as its own image (holgerleichsenring/agentsmith-dashboard), listening on port 3000.
- docker-compose: it's behind the
dashboardprofile —docker compose -f deploy/docker-compose.yml --profile dashboard up -d, then openhttp://localhost:3000. - Kubernetes:
deploy/k8s/10-deployment-dashboard.yaml+11-service-dashboard.yaml.
The dashboard proxies to the server (AGENTSMITH_BACKEND_URL, in compose http://server:8081) so the browser stays same-origin. The server's UI API allows loopback callers always and other origins via AGENTSMITH_DASHBOARD_ORIGIN. There is no built-in login — it's read-only plus cancel, and you put it behind whatever auth proxy your team already uses.
The shell
Every route sits under one header and one rail. The header names the place you are on, and carries the two things that belong to no single page: a gear that opens configuration in one click, and the account — who is signed in, with the identity page and sign-out behind it. Where no authority is configured there is nothing to show, so nothing is shown.
The rail shows the running system and nothing that is a setting: the monitor buckets with live counts, the subsystems (the tracker entry names the tracker it has actually seen polling), and the rollups. Under /config the same rail lists the catalog, the settings singletons, Permissions, and a This installation group — the installation read-out, the connection check and Changes — plus the way back to runs.
Runs
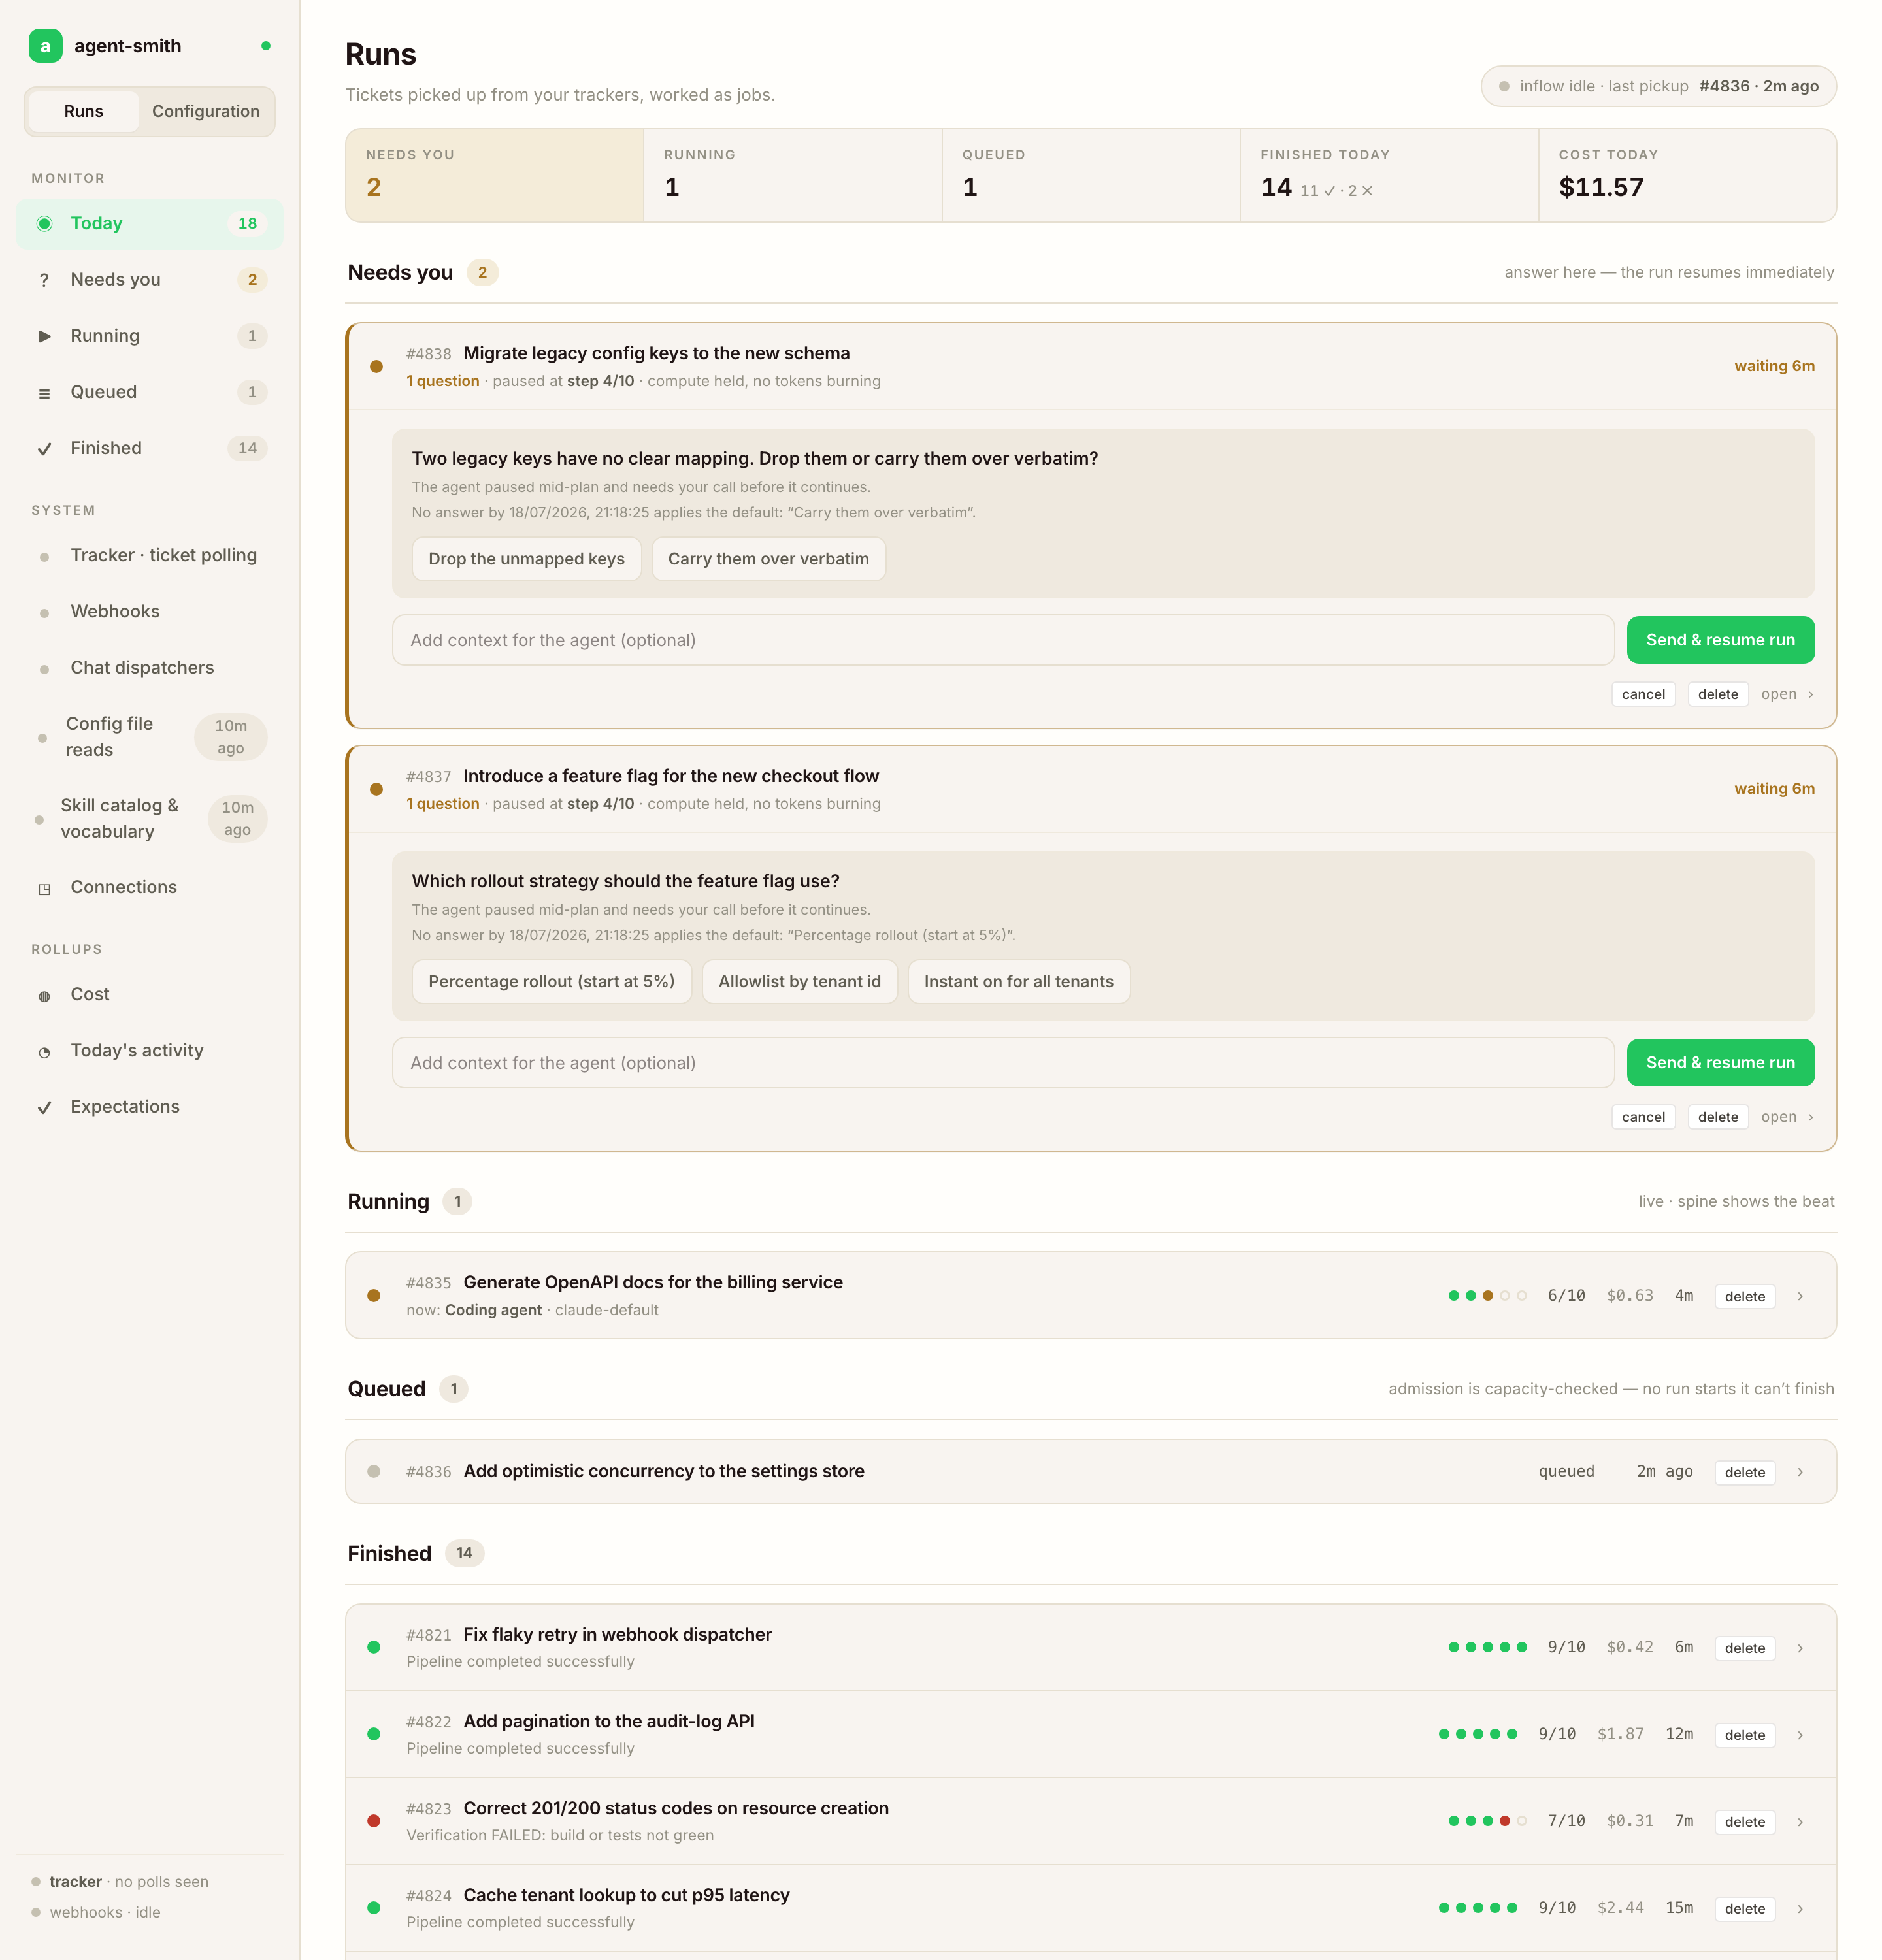
The runs list is dense on purpose — one line per run, Azure-DevOps-style: status glyph, pipeline name, ticket title, repos, real x/y step progress while running, cost so far, age. Filter chips for running / queued / failed / done. New runs appear live; nothing needs a refresh.
Statuses are honest and terminal states are distinct: done, failed, cancelled (its own glyph, not a red herring), queued (amber, with #position in the FIFO and the reason it's waiting), and waiting_for_input (parked on a question — see durable dialogue).
Run detail
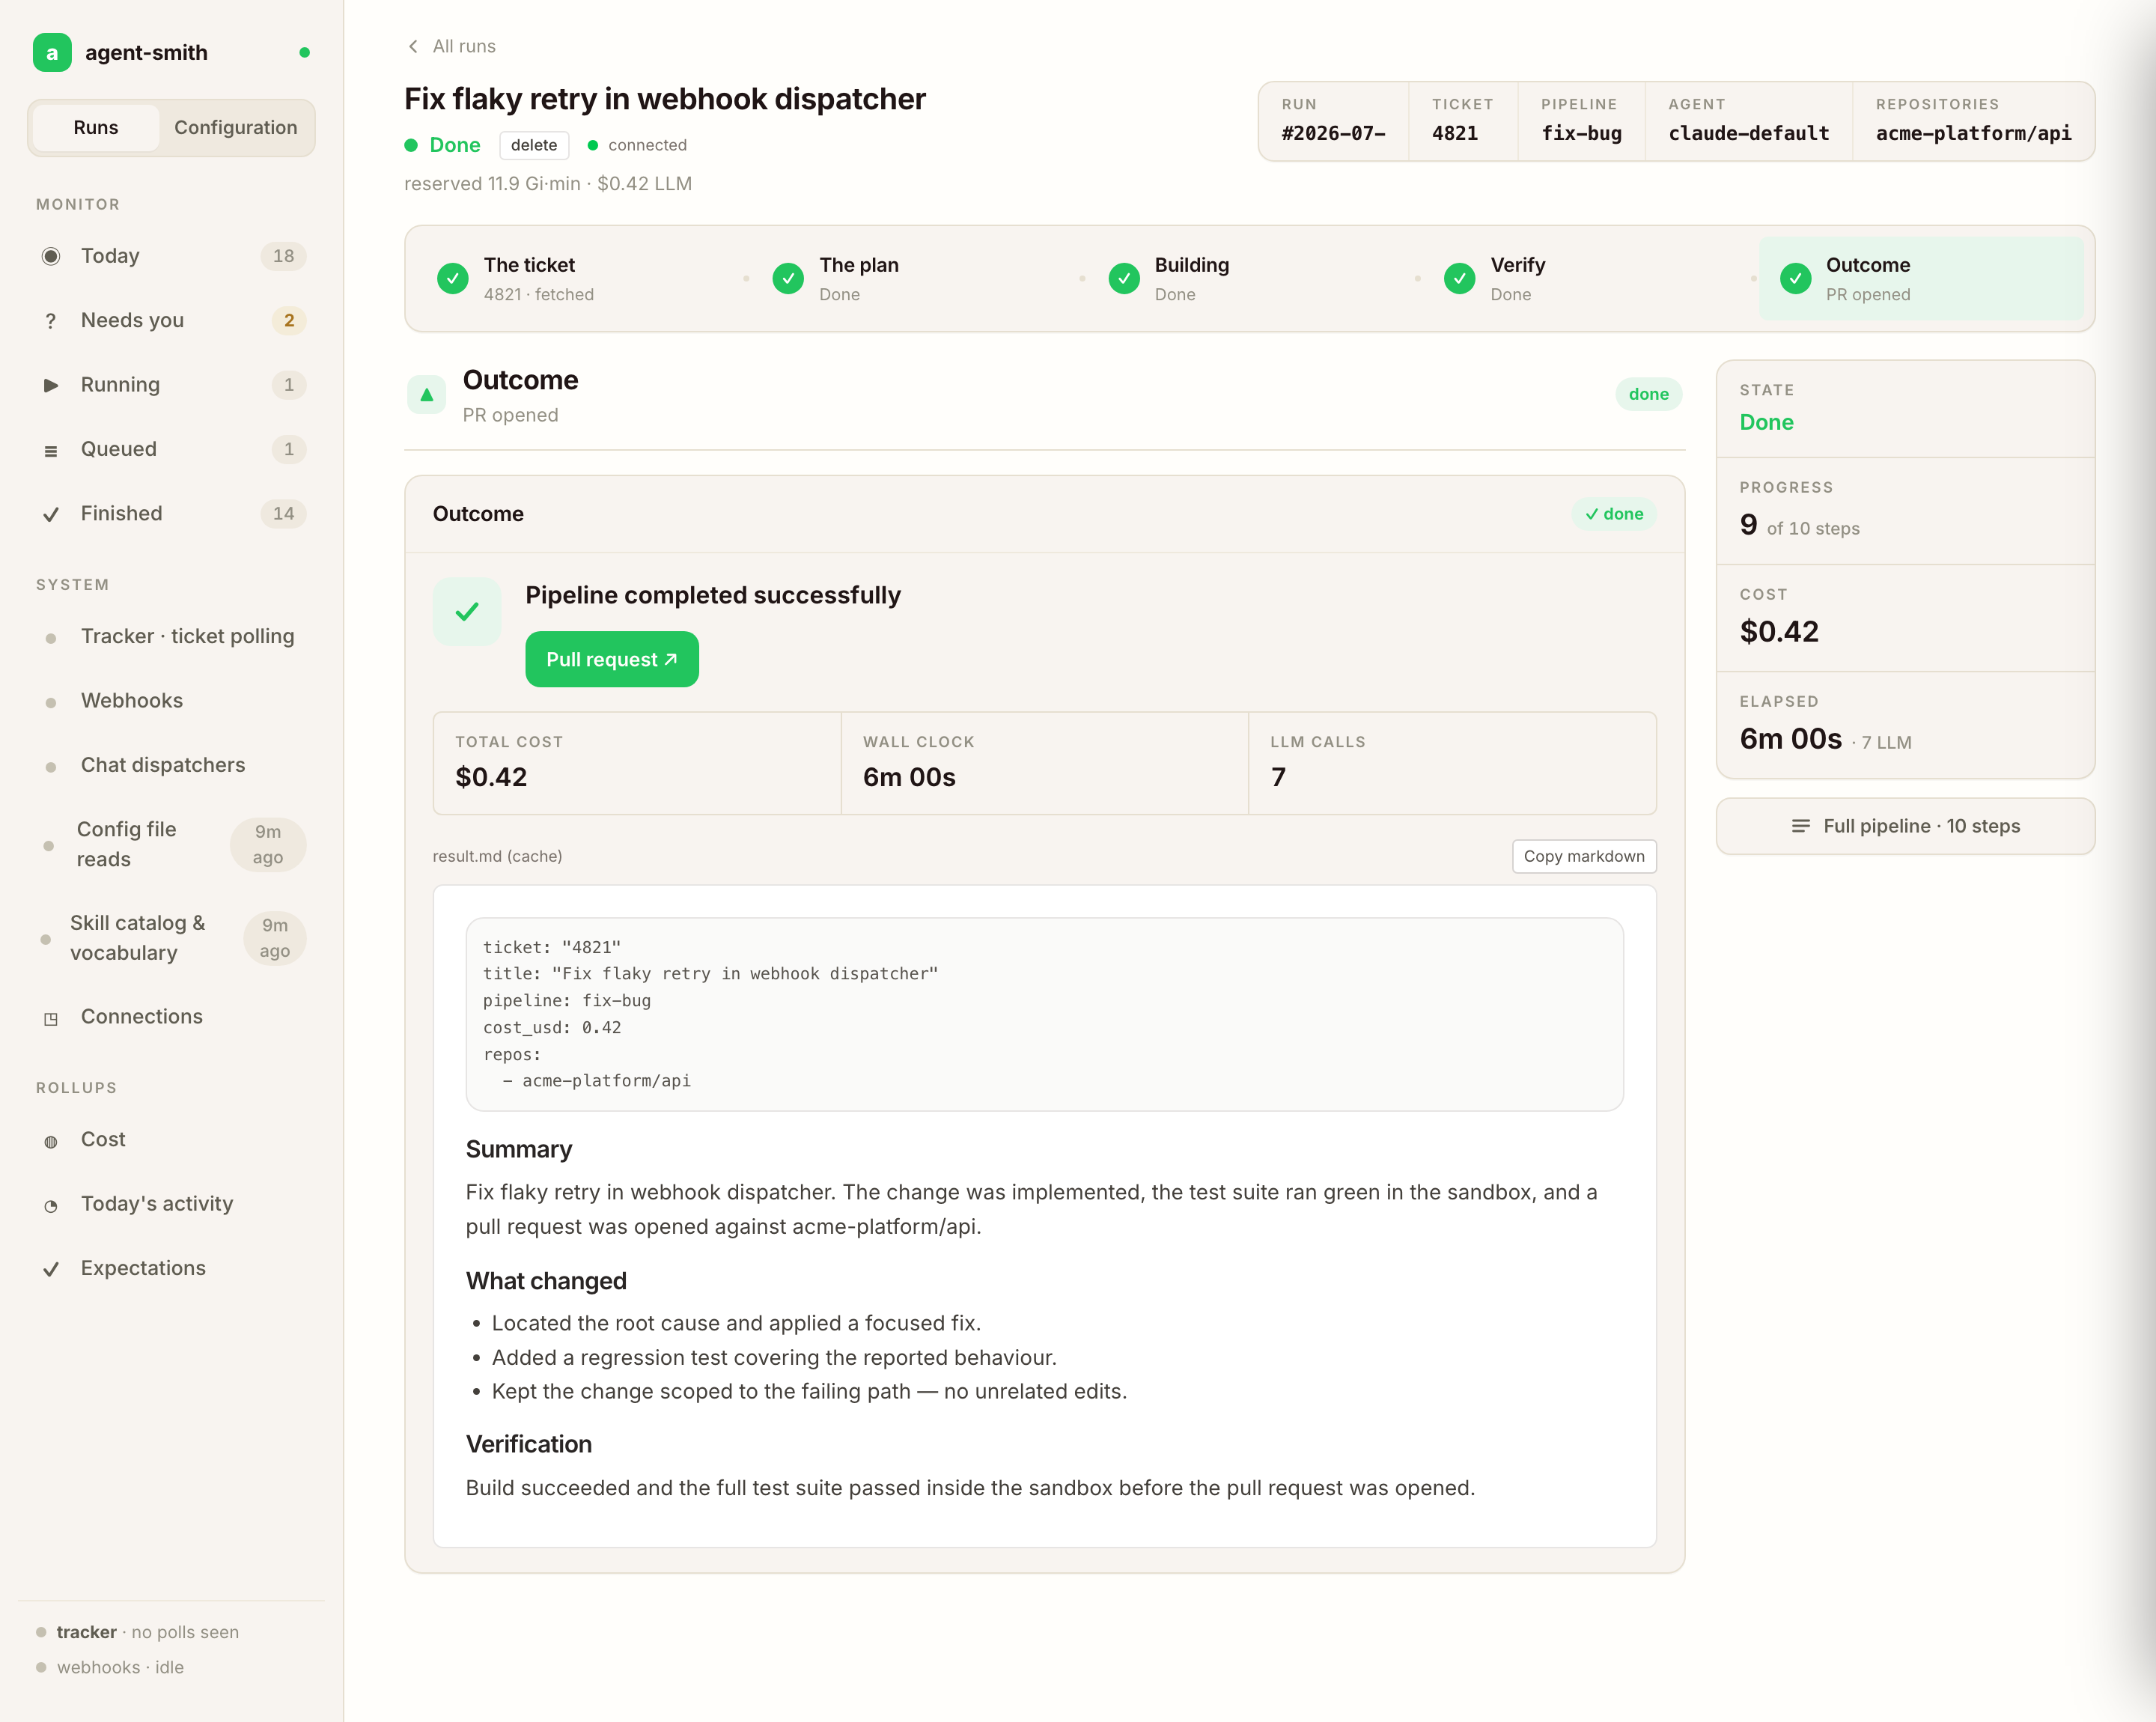
One run reads as a five-beat story — ticket → plan → build → verify → outcome — so you get the arc before the detail; a failed run lights the beat it died in. result.md renders as the primary content, and the full step-by-step timeline is one click away (Full pipeline). What you get per run:
- A live, unified timeline. LLM turns and sandbox commands interleaved chronologically: what the agent thought, what it ran (
dotnet test,grep, file reads/writes), what came back, per repo. The "did it actually run the tests?" question is answerable at a glance. - What the agent understood. The analyzer's output — per-repo language, modules, build/test commands — and the master's
analyze.mdare shown right at their steps, before any code got written. - Per-step LLM cost with model, tokens, and the cached share of input tokens per call. A run whose cached share is 0% has a dead prompt cache — that's an alarm, not a detail (see cost tracking).
- Reserved capacity-time next to the LLM cost — pod-minutes × memory request, so you see whether the run was expensive in tokens or in pods (capacity).
- Honest per-repo outcomes. "No changes — no PR needed" is neutral, a created PR is a clickable link, a real commit failure shows the real reason.
- The result,
result.mdrendered as the primary content, withplan.mdnext to it, including the ratified expectation and anyignored_instructions. - A cancel button that enforces: graceful window, then force-kill, pods released (cancel semantics).
- Failures lead with why — a cancelled run says who cancelled it (operator, watchdog, timeout), a timeout names the limit that fired instead of ".NET task was cancelled".
Sandbox names are speaking (repo-<context>), the header shows which agent/model is active, and every step carries a live one-liner while it works. Event history is retained so yesterday's run is still inspectable in full.
System
The /system view is the answer to "is this thing alive and why didn't my ticket trigger":
- Per-subsystem status (webhooks, pollers, queue consumer, chat adapters, housekeeping) with live/idle freshness and a live event tail per subsystem.
- The trigger log: every received webhook and poll cycle with its verdict — actioned, or skipped with the reason (no matching project, no trigger label, signature invalid). The "why didn't this ticket trigger" question stops being a log-grepping session.
Overview
Insight → Overview is the reading of the system rather than a part of it (2026-08-27-7463;
/system/cost, /system/today and /system/expectations were three pages until then and
still redirect here):
- Spend — today, the trailing 7 days and the LLM calls behind it, with a breakdown of which repos and which pipeline the week's money went to. Every figure is grouped from the run list the dashboard already holds; there is no cost endpoint and no second truth.
- Runs by outcome — the same buckets the rail counts (needs-you, running, queued), with the finished ones split into succeeded, failed and cancelled.
- Criteria outcomes — expectation hit rate and first-PR acceptance per project, from the recorded ratification outcomes. Rates never render as 0% without a measurement.
The old "today's activity" rollup is gone rather than moved: its tickets scanned/triggered/ skipped and poll cycles read on the Tracker page, and its webhooks received/actioned on the Webhooks page, off the same server snapshot it used.
Connections
Configuration → This installation → Connection check is the runtime diagnostics page (p0292/p0293; it lived under System → Connections until 2026-08-27-1ed6, and that path still redirects here): every configured connection — trackers, repo connections, LLM agents, sandbox backend, Redis, database, chat adapters — with a probe button per row and a "Test all". Probes are the cheapest authenticated call against the real dependency, so a red row is a real problem, named. Webhooks get a "secret configured / last delivery seen" panel instead of a probe button (you can't actively probe an inbound webhook from the server side).
The same probes back agent-smith doctor and the server's startup preflight on /health — one probe implementation, three consumers.
Configuration studio
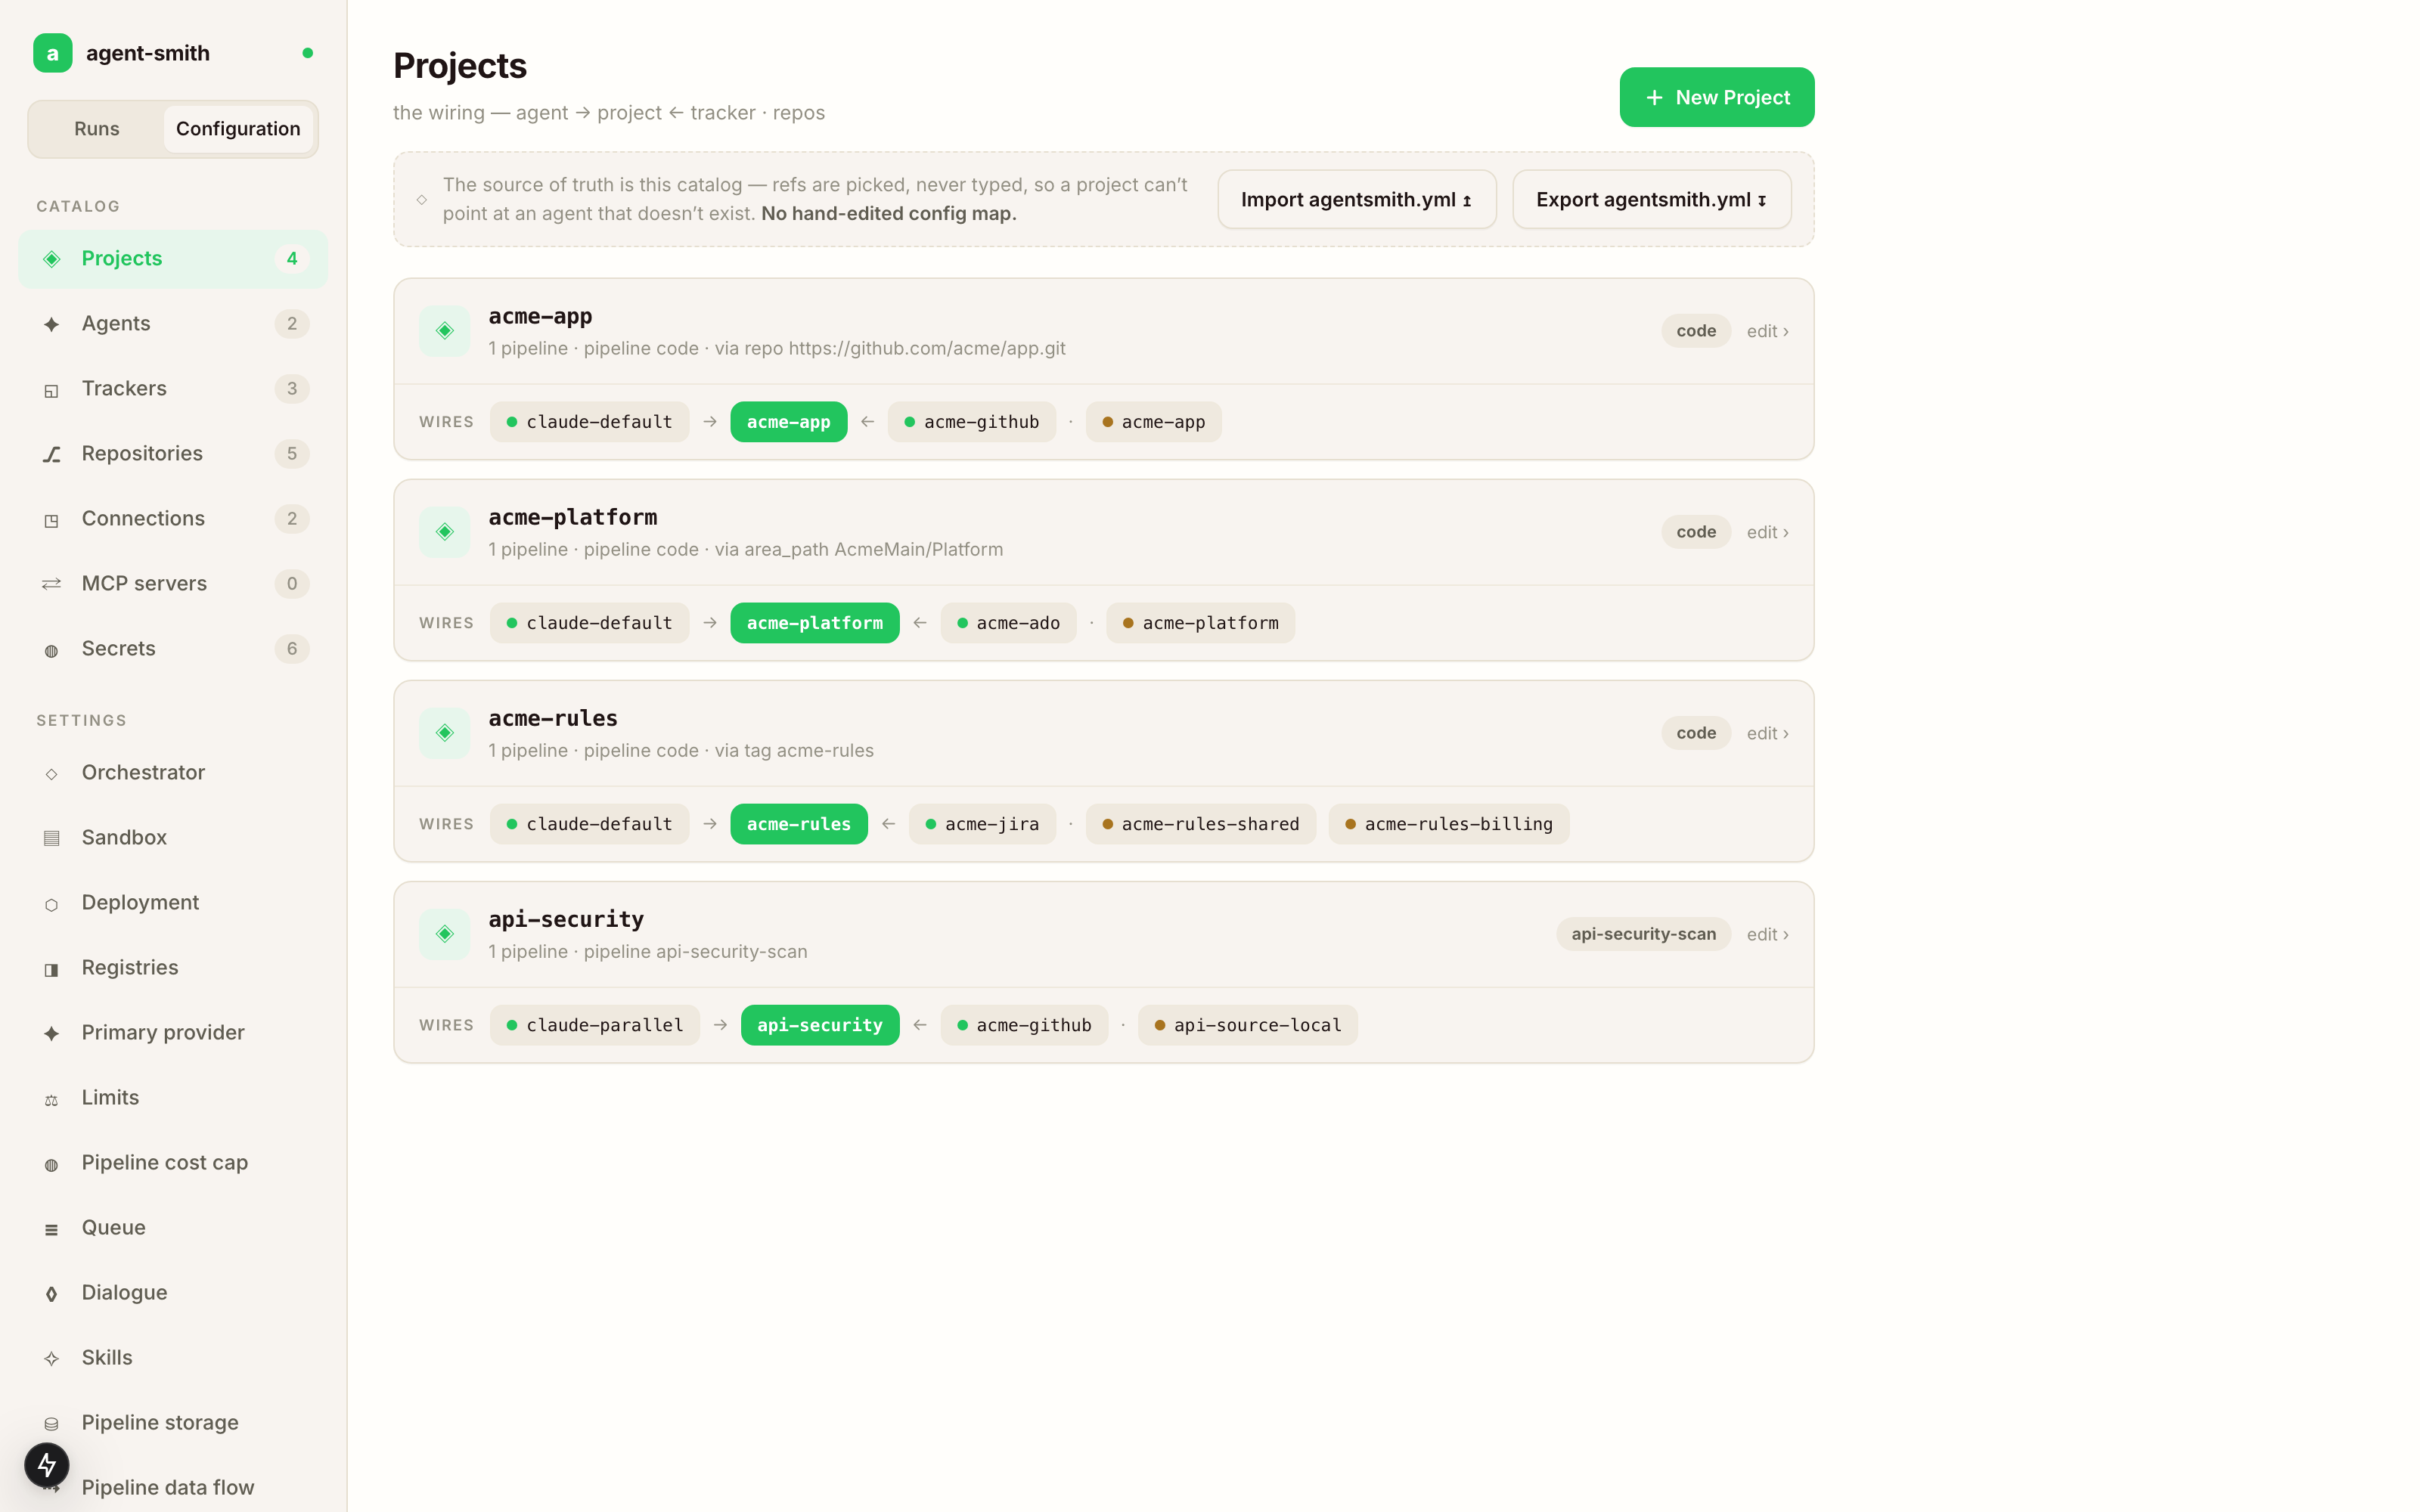
Configuration is a UI now, not only a YAML file you hand-edit. Reached from the header's gear, Configuration is a relational catalog — projects, agents, trackers, repositories, connections, MCP servers, secrets — that you create and edit in place. The defining rule is refs are picked, never typed: a project points at its agent, tracker and repos by choosing them from the catalog, so it can't reference an agent that doesn't exist, and a connection-scoped repo ref either resolves or is flagged. No hand-edited config map, no dangling reference discovered at runtime.
Each project card shows its wiring at a glance — agent → project ← tracker · repos — plus the pipeline it triggers. Every change lands in Changes (an audit trail of what changed and when), and Export agentsmith.yml renders the whole catalog back to the on-disk file at any point. Secrets are referenced by name, never shown.
The YAML file stays the source of truth on disk — it's what the CLI one-shot runs read, and the studio reads and writes it through the same store — so the UI and agentsmith.yml never disagree. The file itself is documented under Configuration.
When a run behaves oddly, this is also where "what config was it actually running under" gets answered: the effective wiring, resolved and redacted.
Catalog
The Catalog view shows the loaded skills catalog — every skill and master with its rendered SKILL.md, plus the concept vocabulary with types and definitions, and where the catalog came from (embedded, path, url, version). The run detail's "Load catalog" step shows the same for the specific run.
Next
- Capacity & queueing — what amber "queued" means and how to size the knobs.
- Server resilience —
/healthvs/health/ready. - Cost tracking — the numbers behind the cost columns.